Parabola Equation: A Real-Life Example (from Public Health)

Parabola equations find application in various real-life scenarios, including space, military, and manufacturing. This article illustrates how they are utilized in the analysis of health-related information.

Mathematics for Analytics of Public Health Data

What is Public Health?

Public health involves various government efforts to ensure the well-being and safety of everyone. It encompasses the promotion of hygiene, vaccination, prevention of drug usage, encouragement of a healthy lifestyle, advocacy for sustainable nutrition, and the prevention of depression, among other things. The goal is to maintain the health and happiness of our entire community.

Who Are Public Health Specialists?

The work of public health specialists is highly diverse, with different professionals engaging in various tasks. Some specialists focus on analytics and forecasting, utilizing mathematics, including parabola equations, to predict and manage collective PTSD. The following section will delve into more details.

What is PTSD?

PTSD stands for Post-Traumatic Stress Disorder, a psychiatric condition that may develop after experiencing a traumatic event like war, earthquakes, or similar incidents. It can also affect a group of individuals who have shared traumatic experiences, such as a terrorist attack. Effective public health systems should be capable of predicting the emergence of collective PTSD and responding appropriately.

Using Parabola Equations for Forecasting PTSD: An Example

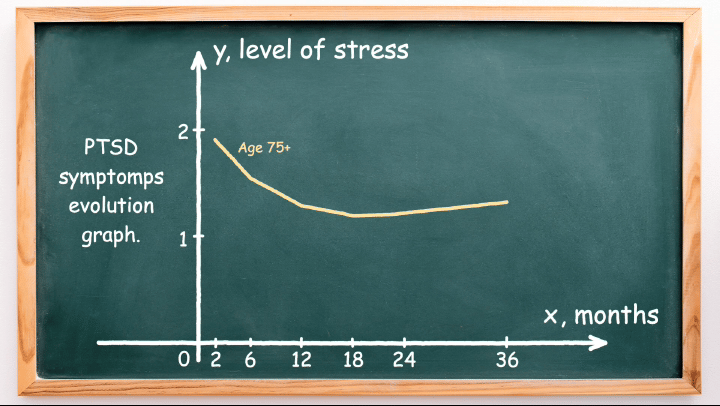
Take a look at the graph presented below.

This graph, plotted on a Cartesian coordinate plane, illustrates the evolution of stress levels over time for two age groups that have experienced a terrorist attack. The x-axis represents time elapsed since the attack, while the y-axis represents the stress level.

Notably, for young people, the stress level fluctuates, reaching peaks at months 12 and 24. In contrast, for older individuals, the stress level steadily decreases in the first year, remains stable in the second year, and then increases.

You might have observed that the curve for older individuals resembles a graph of a quadratic function or parabola. Indeed, we can find a parabola equation that approximately matches the curve, represented by:

\[y = 0.0014x^2 – 0.07x + 2,\]

where the domain of this function is restricted to \(x\) values from 2 to 36:

\[x \in [2, 36]\].

The animation below displays the combination of this parabola with the curve for older individuals:

Animation showing a combination of a line (representing stress for older people) and a parabola.

What Happens After Finding the Parabola Equation?

Once we’ve identified a parabola equation that fits the data, specialized computer software can automatically analyze this information and generate forecasts. For instance, the software can predict the potential number of people requiring assistance from psychologists in the next 12 months. It can then automatically check if the district has a sufficient number of psychologists available. If there’s a shortage, local governments can take necessary measures.

Conclusion:

This serves as an example of how public health specialists predict the number of individuals who may require medical assistance in the future. It demonstrates the impressive predictive power of mathematics. Once we can describe a phenomenon in mathematical language, we gain the ability to make accurate forecasts. In this instance, we’ve used mathematical language to describe how the stress levels of people change over time.

References:

During the preparation of this article, we relied on the following scientific publication:

In addition, the following video, issued by the National Collaborating Centre for Infectious Diseases (Canada), explains the basics of mathematical modeling in public health:

Video version

The video version of this article presents the explanation in an easy-to-follow, animated format. It delves into other aspects of public health and how it has evolved over the past 100 years. Enjoy the preview below, or subscribe to gain access to the full video.

Further reading:

In the beginning of this article, we have shown two graphs – one modeling the development of PTSD symptoms for young people and another modeling symptoms for older people (our current example). The curve for young people can also be modeled using mathematical functions (particularly piecewise linear functions), and we have a blog post explaining that. So, if you are familiar with piecewise linear functions, the following article is for you: 

This article serves as an excellent example of the interconnectedness between math and psychology. Additionally, explore another article that delves into a different example showcasing the connection between math and psychology:

Finally, understanding this article requires an understanding of what a Cartesian coordinate plane is. If you are interested in how Cartesian coordinates are used in other real-life scenarios, then the following blog post is for you:

Want to receive a notification when we publish new article?
Like this article?
Read more from our blog:

What Real-Life Math Topic Interests You?

Interested in seeing how a specific math topic is applied in the real world?

Let us know your preferred topic, and we’ll create a blog post and video showcasing its practical applications.

If you’d like, you can also let us know which real-world domain you’d like us to explore!