Watch or read?
Would you like to explore this example through a short video or text? If you prefer the video, check out the preview on the right (or below if you’re on a mobile device).
The video includes animated explanations and additional examples.
Prefer text? Just keep reading!
Introduction
Medicine might not be the first thing you connect with math. But math shows up in medicine more often than you’d think. Nurses must understand how to convert units to calculate drug doses. Doctors use Cartesian coordinates to study survival rates or track medical data.
In this article, we’ll look at how vector math — something you learn in high school — helps cardiologists understand how the heart works.
What is cardiology?
Cardiology is the branch of medicine that studies the heart and how it works. Cardiologists diagnose and treat problems that affect the heart and blood vessels.
What is an ECG?
An important tool in cardiology is the ECG, short for ElectroCardioGraphy. It records tiny electrical signals produced by the heart. Simply put, these signals are what make the heart contract and keep it beating in rhythm.
What is a vectorcardiogram?
In a healthy heart, electrical signals spread through the heart in a looping pattern — almost like a circle from right to left.

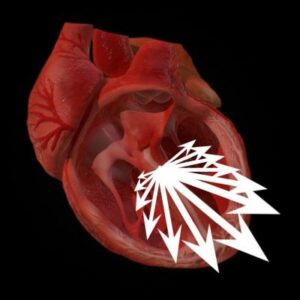
This pattern is called a vectorcardiogram. Each signal can be shown as a vector, which means it has both a magnitude (measured in millivolts) and a direction (measured in degrees). Thinking of these signals as vectors helps doctors understand how electricity moves through the heart.
These electrical signals are recorded by an ECG machine, which displays or prints them for cardiologists to study and interpret.

ECG is provided by MoodyGroove. Public Domain, https://commons.wikimedia.org/w/index.php?curid=5266589
Vectorcardiogram of a healthy heart
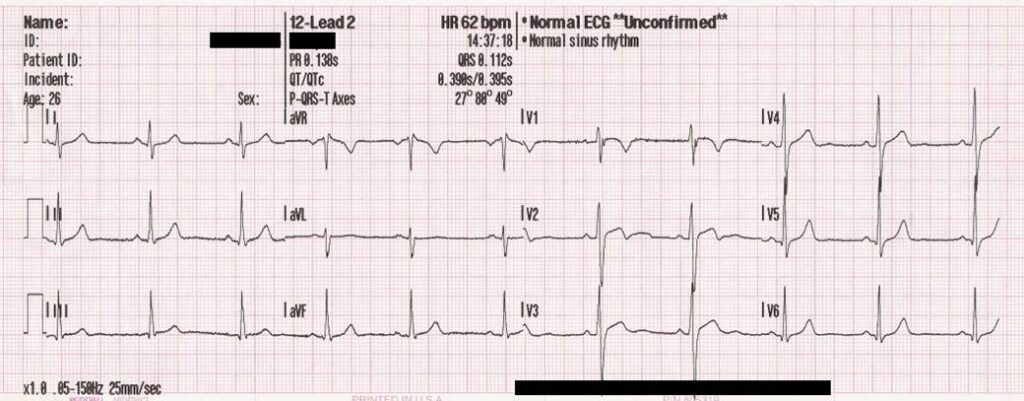
In the picture, you can see one example of a vectorcardiogram from a healthy adult heart.
For simplicity, let’s focus on just three vectors from the vectorcardiogram — one from the beginning, one from the middle, and one from the end.

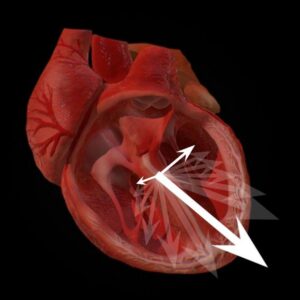
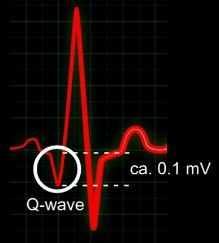
The first vector has a smaller magnitude and points in a negative direction. On the ECG of a healthy heart, this vector shows up as a small downward deflection called the Q wave, which usually has an amplitude of about 0.1 millivolt.

There is more in the video!
But a Q wave doesn’t always look the same. In people who have had a myocardial infarction (a heart attack), the vectorcardiogram changes. High school vector math is a very useful tool to understand these changes.
Our video (preview) explains this in detail with lots of animated examples. It shows how high school math helps cardiologists detect heart attacks and even figure out which part of the heart may be affected.
Conclusion
Vectors are a powerful tool that help both medical students and cardiologists understand how electrical signals move through the heart. They also make it easier to notice small changes in an ECG that could signal heart problems and to figure out which part of the heart may be affected.
If you dream of becoming a great cardiologist and helping save lives, learning about vectors is an important step.